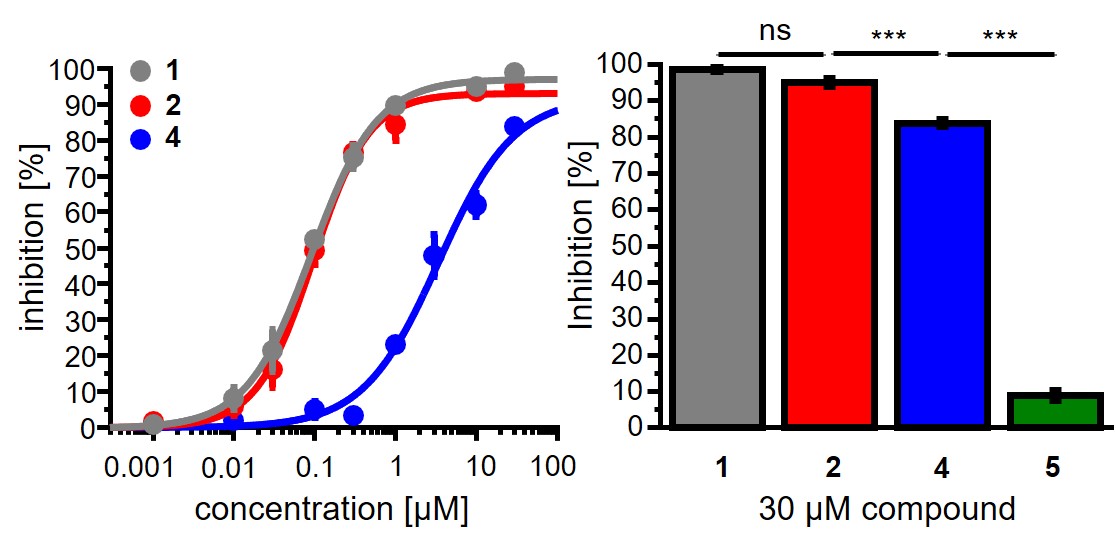
Fig. 6. Left: Dose-response curves derived from inhibition of GluN1-1a/GluN2B expressing oocytes at ascending concentrations of compounds 1 (gray), 2 (red) and 4 (blue). The holding potential was set to -70 mV and the receptors were activated by 10 µM glycine and 10 µM (S)-glutamate. Right: inhibition (% ± SEM) of 30 µM 1, 2, 4 and 5 at GluN1/GluN2B expressing oocytes. Significance of mean differences was tested by one-way ANOVA with post hoc mean comparison Tukey test (*** p<0.001; ns p > 0.05).